A Novel Framework for Studying the Cognitive Science of Voting
Objective
The goal of this dissertation research was to investigate how individuals understand, evaluate, and choose between different voting systems. By creating a bridge between political science and cognitive psychology, I sought to determine if people have consistent "meta-preferences" for how elections should be decided and how their understanding of these complex systems changes through interactive learning.
Background
While there is extensive research from the fields of political science, economics, and mathematics on voting methods (e.g., Plurality vs. Ranked-Choice), we know relatively little about the cognitive process of being a voter under these different rules. Most people only experience Plurality voting, yet many alternative systems exist, each with different mathematical trade-offs that operationalize fairness differently. I investigated whether individuals can perceive these trade-offs and whether their support for a specific voting system is stable or is easily influenced by how information is presented.
My role and responsibilities
As a doctoral researcher at the University of Pittsburgh, I:
• Architected a multi-study behavioral research program, managing the experimental lifecycle for hundreds of participants.
• Engineered the mathematical logic for several voting algorithms, including Plurality, Ranked-Choice (IRV), and Cardinal voting systems.
• Developed full-stack applets and interactive widgets within Qualtrics to create immersive, data-driven participant environments.
• Synthesized complex election theory into novel instructional interventions that significantly improved user comprehension of democratic systems.
Methods and Approach
I developed a "Spatial Voting" framework where voters and candidates are placed in a 2D space representing political or preference dimensions.
1. Preference Mapping: I tasked participants with choosing their "preferred winner" across dozens of unique election maps to see if they consistently favored candidates who won in a particular voting system.
2. Educational Intervention: I tested whether teaching people about voting criteria (e.g., the Spoiler Effect) changed their preferences for specific election systems.
3. Interactive tool with teaching intervention: Participants used a custom-built tool to visualize how moving candidates or voters changed the winner under different rules.
4. Consistency Metrics: I used mathematical modeling to calculate how often a participant's choices aligned with specific voting rules.
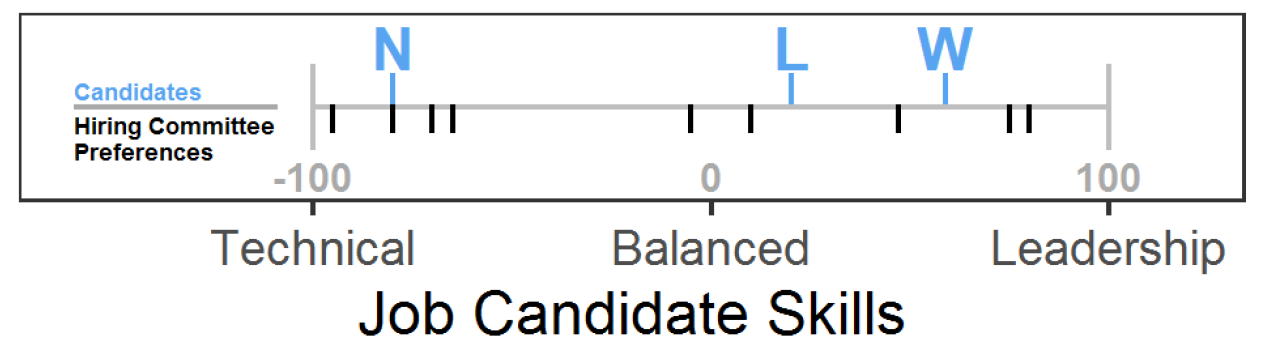
Figure 1. Example stimuli for Who Won the Election Task (WWET). In the WWET, participants were asked to imagine that they worked for a company deciding to hire a new employee from three candidates. Each member of the hiring committee voted on whether they wanted a candidate who excelled technically or in terms of leadership on a -100 to +100 scale, and each candidate was assessed through the hiring process at a specific number on the same scale. The graph provided to participants represented the preferences of the hiring committee members (vertical black lines) and the candidates preferences (vertical blue lines and letters). Participants were asked, “Based on the preferences of the hiring committee members in the graph above, which job candidate do you think should be hired?”
From the figures in the WWET, it is possible to determine which candidate should be hired according to plurality, RCV, and cardinal voting. In this example, Candidate N wins according to plurality voting, because 4 committee members are closest to N, whereas 3 are closest to W and 2 are closest to L. Candidate W wins according to RCV. Since Candidate N had 4 out of 9 votes in the first round, which is less than 50%, an instant-runoff would occur. Candidate L would be eliminated in the instant-runoff because L has the least number of votes. The two voters in the middle of the scale are closer to W than N, so W would win the election with 5 out of 9 votes. Candidate L wins according to cardinal voting because L has a lower average distance to all 9 committee members (63.00) than N (71.90) or W (78.70).
From the figures in the WWET, it is possible to determine which candidate should be hired according to plurality, RCV, and cardinal voting. In this example, Candidate N wins according to plurality voting, because 4 committee members are closest to N, whereas 3 are closest to W and 2 are closest to L. Candidate W wins according to RCV. Since Candidate N had 4 out of 9 votes in the first round, which is less than 50%, an instant-runoff would occur. Candidate L would be eliminated in the instant-runoff because L has the least number of votes. The two voters in the middle of the scale are closer to W than N, so W would win the election with 5 out of 9 votes. Candidate L wins according to cardinal voting because L has a lower average distance to all 9 committee members (63.00) than N (71.90) or W (78.70).
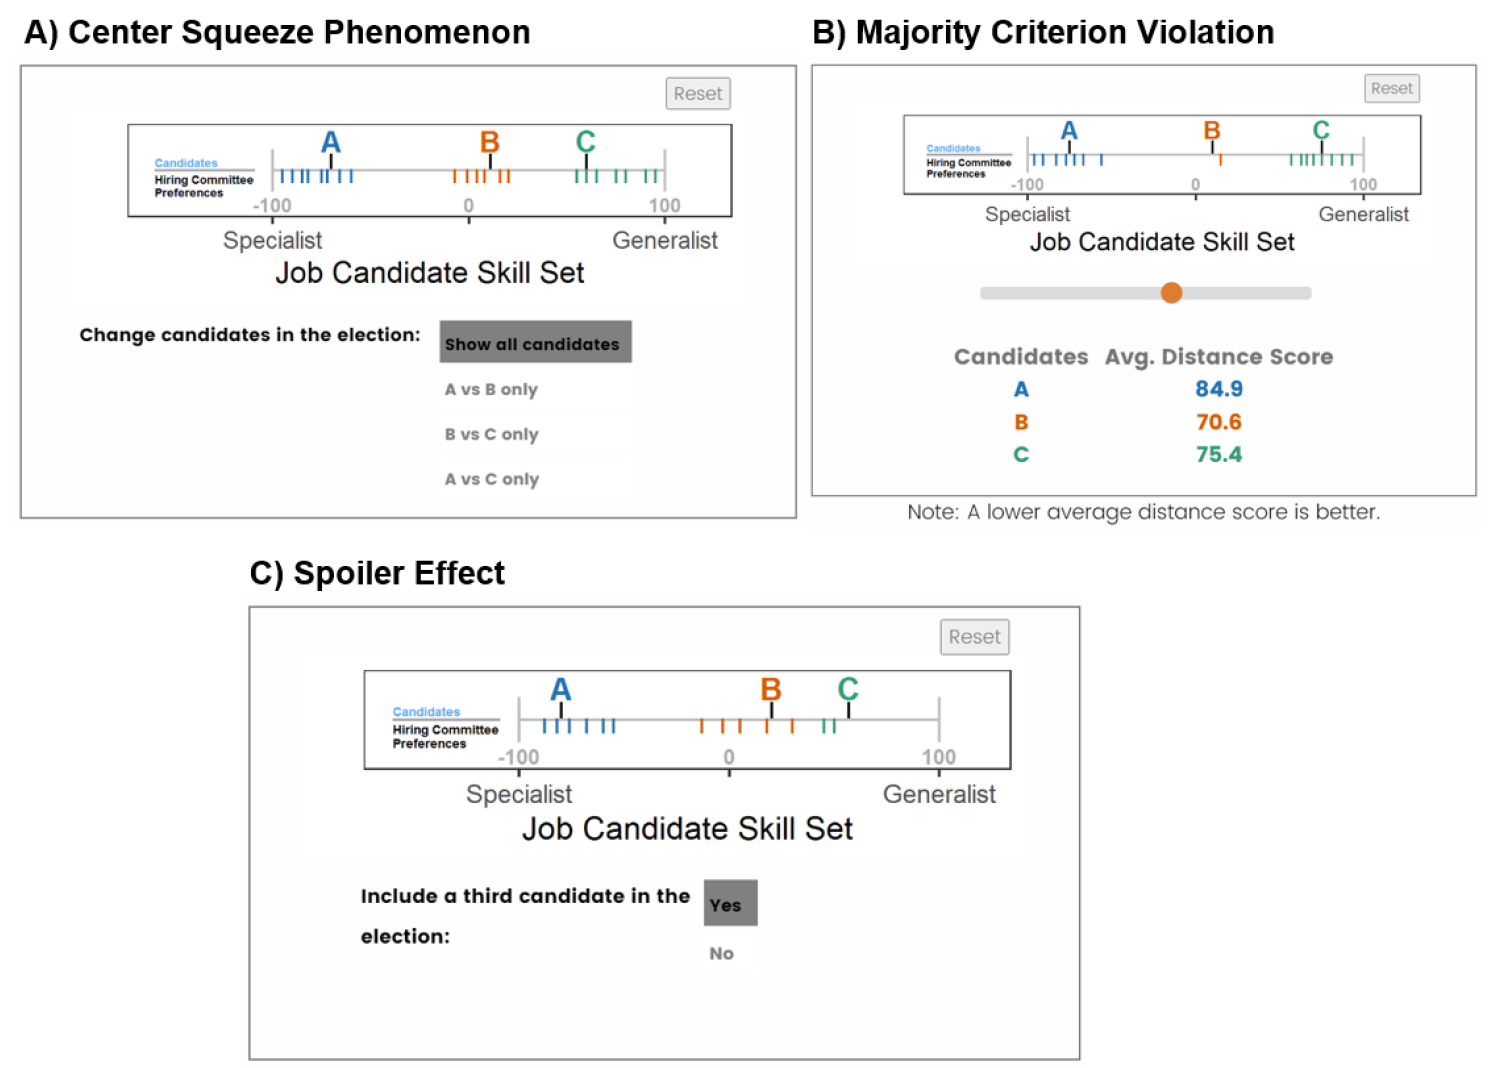
Figure 2. Screenshots of applet for “center squeeze phenomenon” (A), “majority criterion violation” (B), and “spoiler effect” (C). These applets were created in JavaScript and piped into Qualtrics. They created an interactive display were participants could change aspects of the scenario in order to discovery important truths about how the different voting systems work.
Findings
My research revealed that most individuals do not have a single, stable "ideal" voting system in mind. Instead, people are often inconsistent, choosing winners that would be picked by different systems across different trials. However, I found that providing interactive, visual tools significantly improved people's ability to understand the nuances of systems like Ranked-Choice Voting.
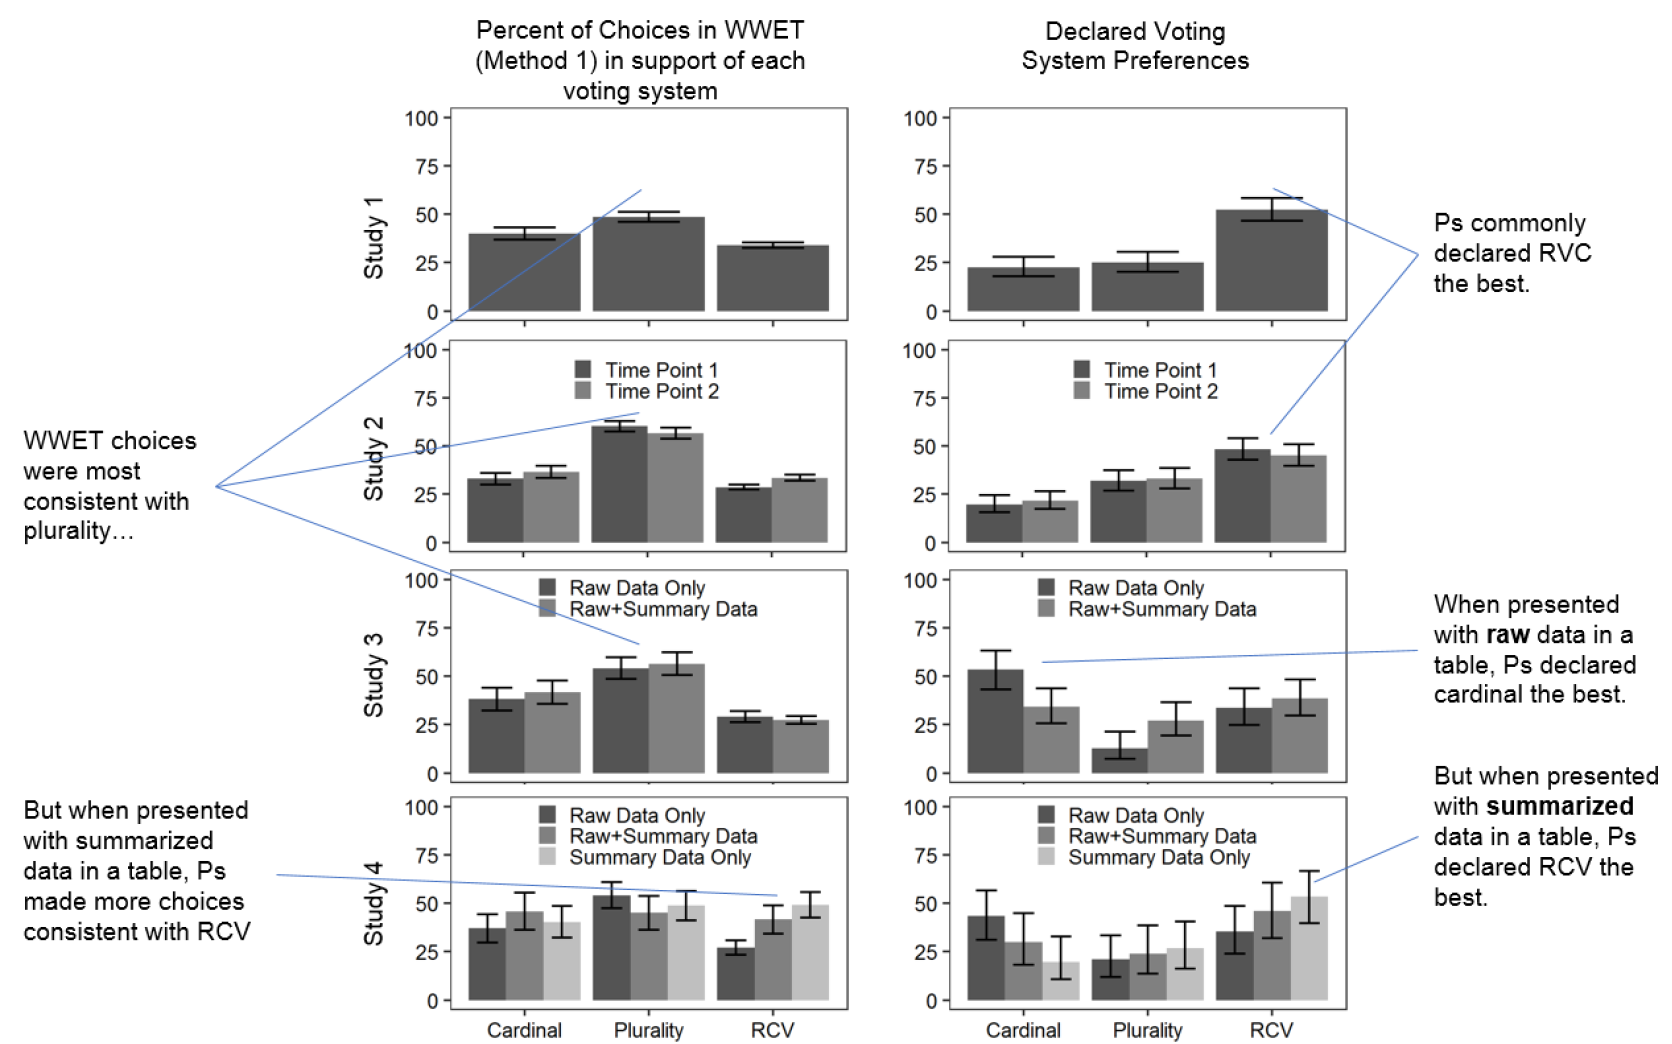
Figure 3. Percent of choices in WWET in support of each voting system and declared voting system preferences and 95% CIs. Note: Some choices in the WWET support two voting systems, so the bars add up to over 100%. For studies in which the tasks were performed more than once, the first is shown. Declared voting systems refers to the preferred voting system when directly asked, whereas WWET choices are choices from viewing data in the Who Won the Election Task. We typically found that participants stated preferring ranked-choice voting but made choices from data that were consistent with plurity voting.
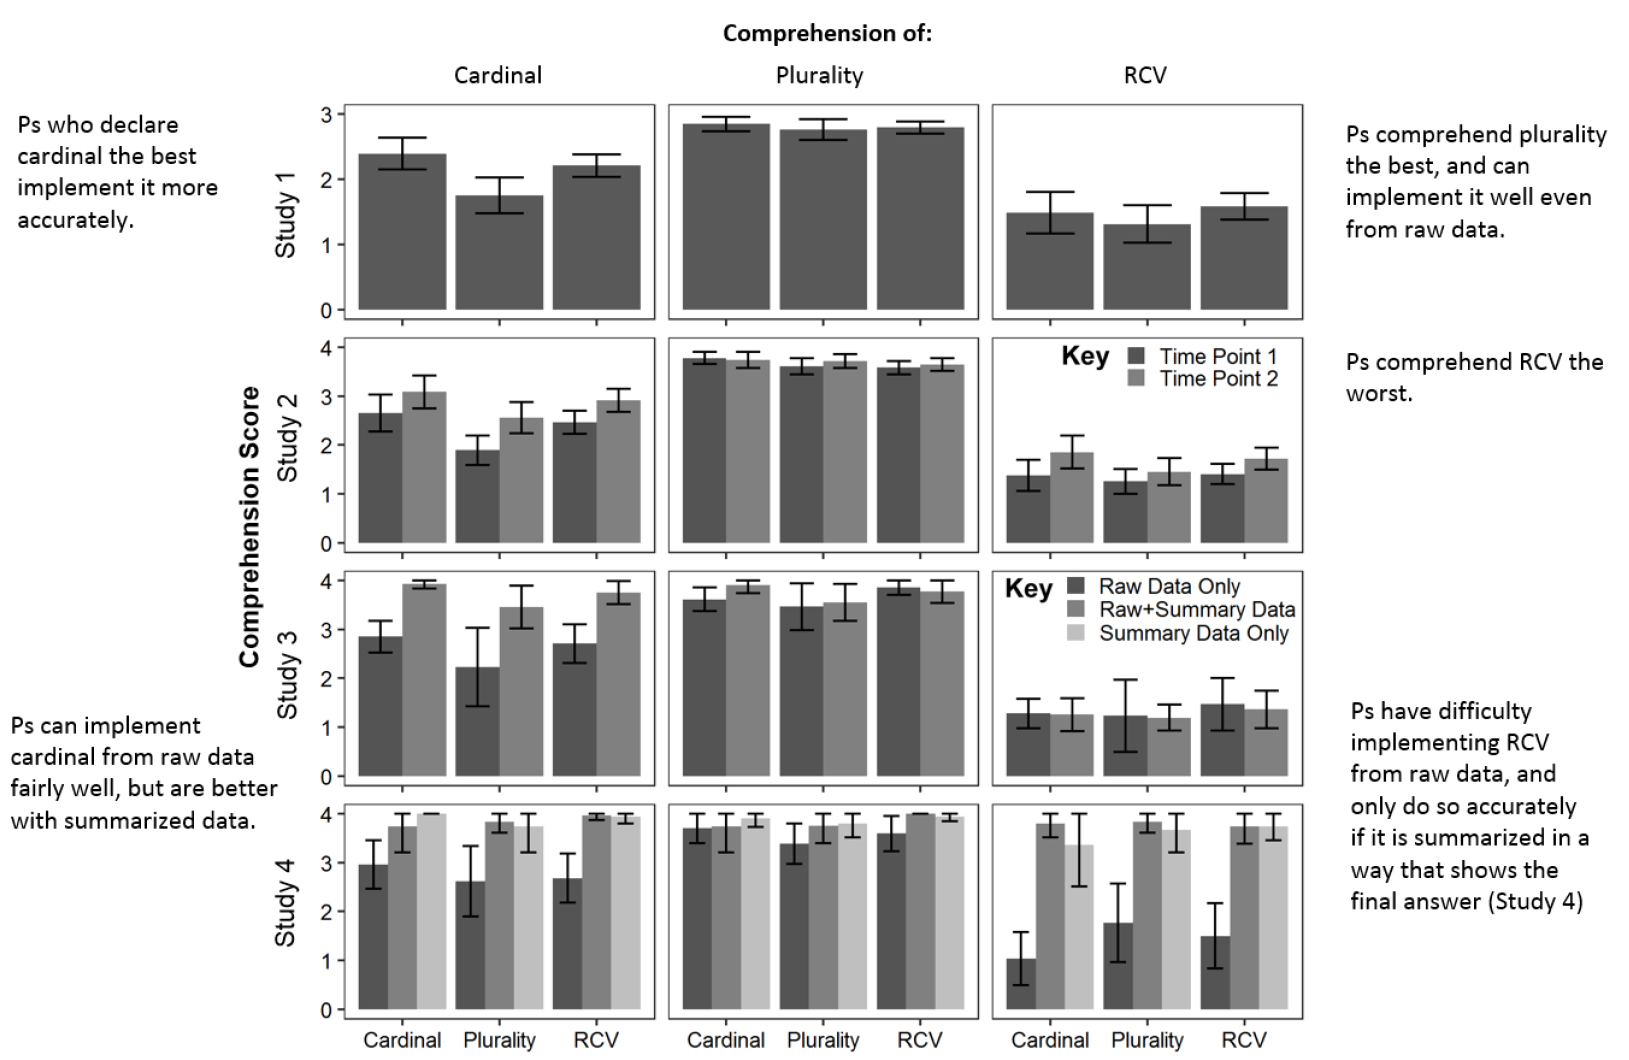
Figure 4. Comprehension scores for the three voting by preferred voting system. In general, participants had an excellent understanding of how plurality voting works, but struggled to understand how ranked-choice voting works.
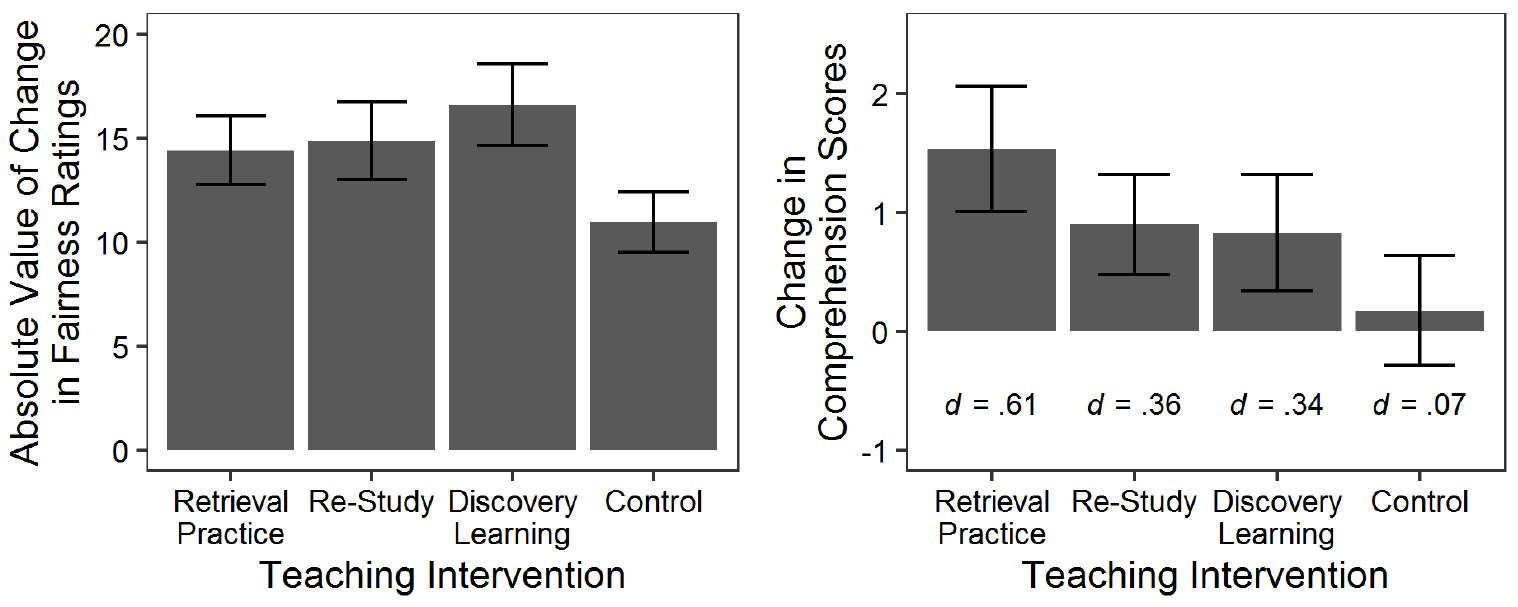
Figure 5. Belief Change in Fairness Ratings Across Teaching Intervention (left panel) & Mean (95% CI) Change in Comprehension Scores by Teaching Intervention in Study 2 (right panel). Here we see that participants changed how fair they felt each voting system was in response to all three teaching intervention strategies (retrieval practice, re-study, and discovery learning)--even just viewing the election figures a second time after learning about the voting systems had an impact on their ratings (control condition). Lastly, we see in the second panel that retrieval practice was the msot effective intervention for increasing comprehension of how the voting systems work.
Significance
This work represents a major step in the "Cognitive Science of Voting." It demonstrates that the adoption of new election systems (like Ranked-Choice Voting in the U.S.) is not just a political hurdle, but a cognitive one. By building tools that increase literacy of voting systems, we can better design democratic processes that reflect what people actually value in an election outcome.
Collaborators
Benjamin Rottman (Dissertation advisor)
Scott Fraundorf (Committee Member)
Kevin R. Binning (Committee Member)
Nicholas R. Miller (Committee Member)
Associated Publications
Caddick, Z.A. (2022). Learning, Choice Consistency, and Individual Differences in How People Think Elections Should Be Decided. Doctoral Dissertation. Link
Tools and Software UsedR, Javascript, Qualtrics, Excel, various scientific search engines (e.g., Google Scholar, PubMed, PsycInfo).
Resources
My dissertation data is available on Github and can be found here and my novel study materials (stimuli and qualtrics files) can be found here.
I pre-registered all four of my studies on OSF, which can be found here.
I created an interactive RShiny tool based on my dissertation materials, which can be seen here: zcaddick.shinyapps.io/rshiny_voting_system_comparisons/. You can find the code for the RShiny tool here.